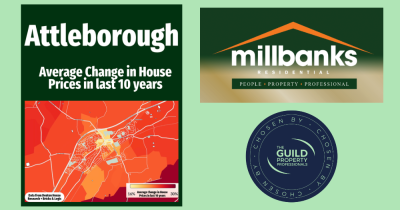
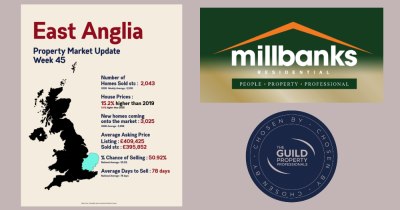
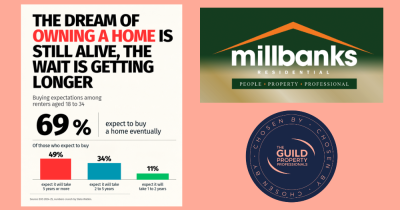
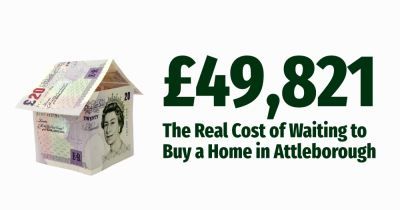
What has happened to House Prices across Attleborough in the last 10 years?
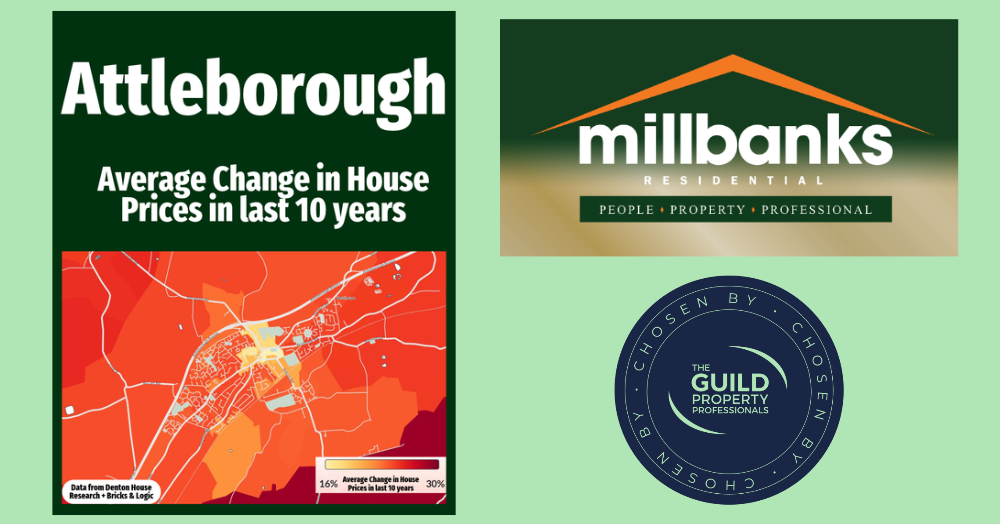
How much have house prices risen in your part of Attleborough over the past 10 years? Not every neighbourhood has experienced the same growth, with some areas outperforming others. Discover what our latest property price map reveals about local trends and why your street matters. Click the link below to learn more.
Talk about the average house price in Attleborough and it can sound as though every homeowner has experienced the same market. The reality is very different. Over the last ten years, different parts of Attleborough have seen noticeably different levels of house price growth. Some neighbourhoods have performed considerably more strongly than the wider Attleborough average, while others have experienced much more modest increases.
That is important because the Attleborough property market is not one single market. Different streets, developments and neighbourhoods can behave differently depending on the type of homes available, buyer demand, local amenities, schools, transport links and the balance between supply and demand. The figures shown on the map are averages, not valuations. Two homes a few streets apart can have very different values, and even two apparently similar properties on the same road can achieve different prices because of condition, size, plot, position and presentation.
So, while these figures give a fascinating picture of how the different parts of Attleborough have changed over the last decade, when it comes to your own home, local knowledge and comparable evidence still matter.
Looking at Buying a Property?
Register your own property requirements with us by Clicking this Link to receive properties that match your own set criteria
Curious about what the Value of Your Own Home is?
Then why not try our 60 Second Instant Valuation Tool by Clicking this Link