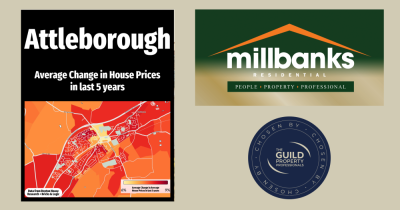
Average House Price Growth in the last 5 years
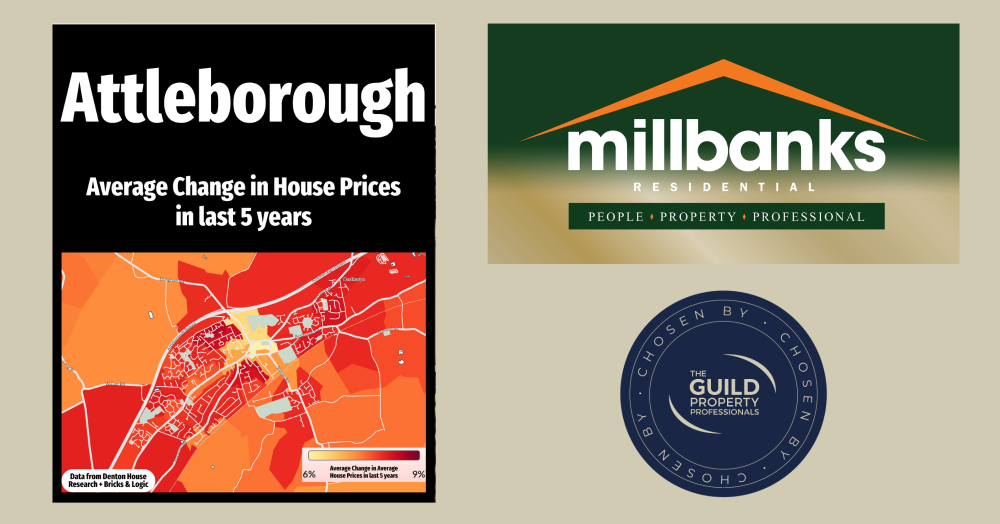
How much has your Attleborough home increased in value over the last five years? The answer may depend on where you live. Our latest property price map reveals how different neighbourhoods have performed, why some have seen stronger growth and what this could mean for your home's value today.
House prices in Attleborough have changed a great deal over the last five years, but not every part of the town has moved at the same pace.
This map shows the average change in house prices across Attleborough, with the darker colours highlighting the areas where values have risen the most, and the lighter colours showing where growth has been more modest. Across much of the UK, average house prices have typically risen by around 14% to 21% over the last five years, depending on the region, but every town and city has its own story beneath the headline numbers.
That is why local knowledge matters.
Two streets can sit only a few minutes apart, yet perform very differently because of property type, school catchments, transport links, buyer demand, stock levels and the condition of homes coming to market.
The key message for Attleborough homeowners is this: the market has not moved evenly. Some homes may now be worth considerably more than their owners realise, while others may need a more careful pricing strategy to attract today’s buyers.
If you would like to discuss the value of your Attleborough home, feel free to give the office a call for an informal no obligation chat.
If you'd like to find out what your home might be worth in 60 Seconds, please 'click this link'.